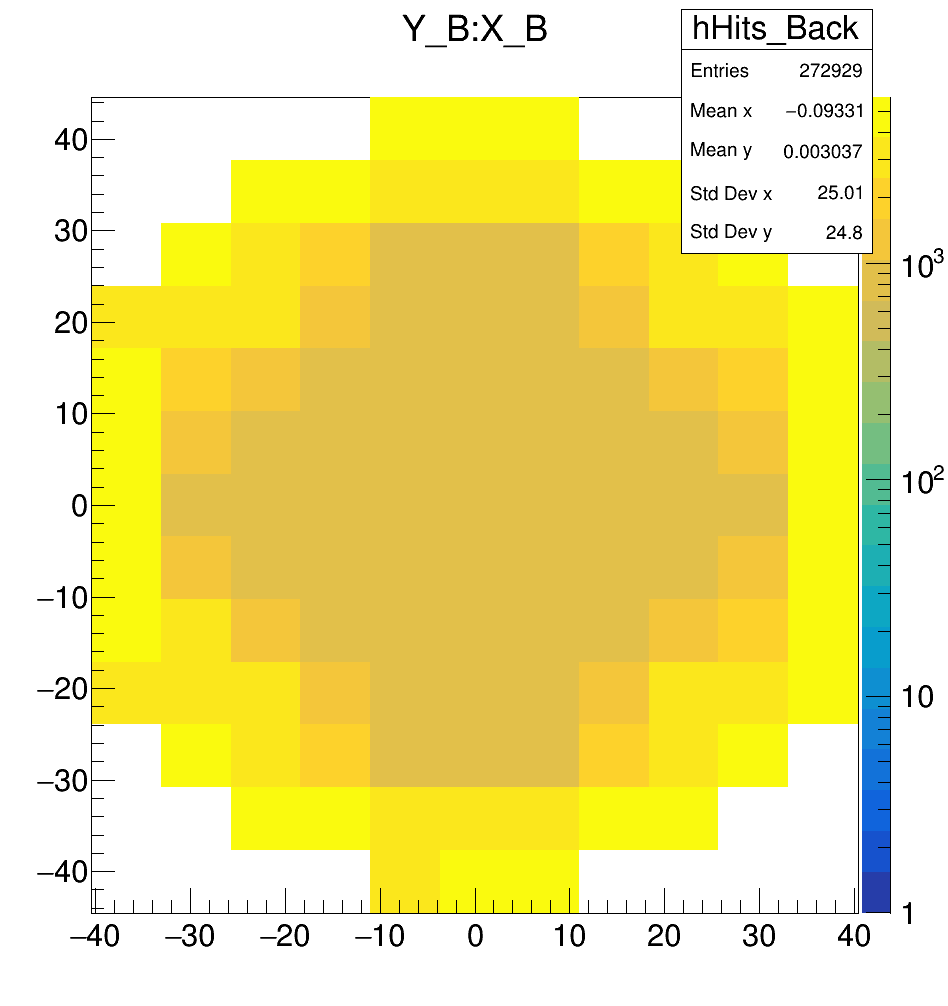
A series of graphs with corresponding fast commands for the ROOT interpreter.
Standard mode: output example
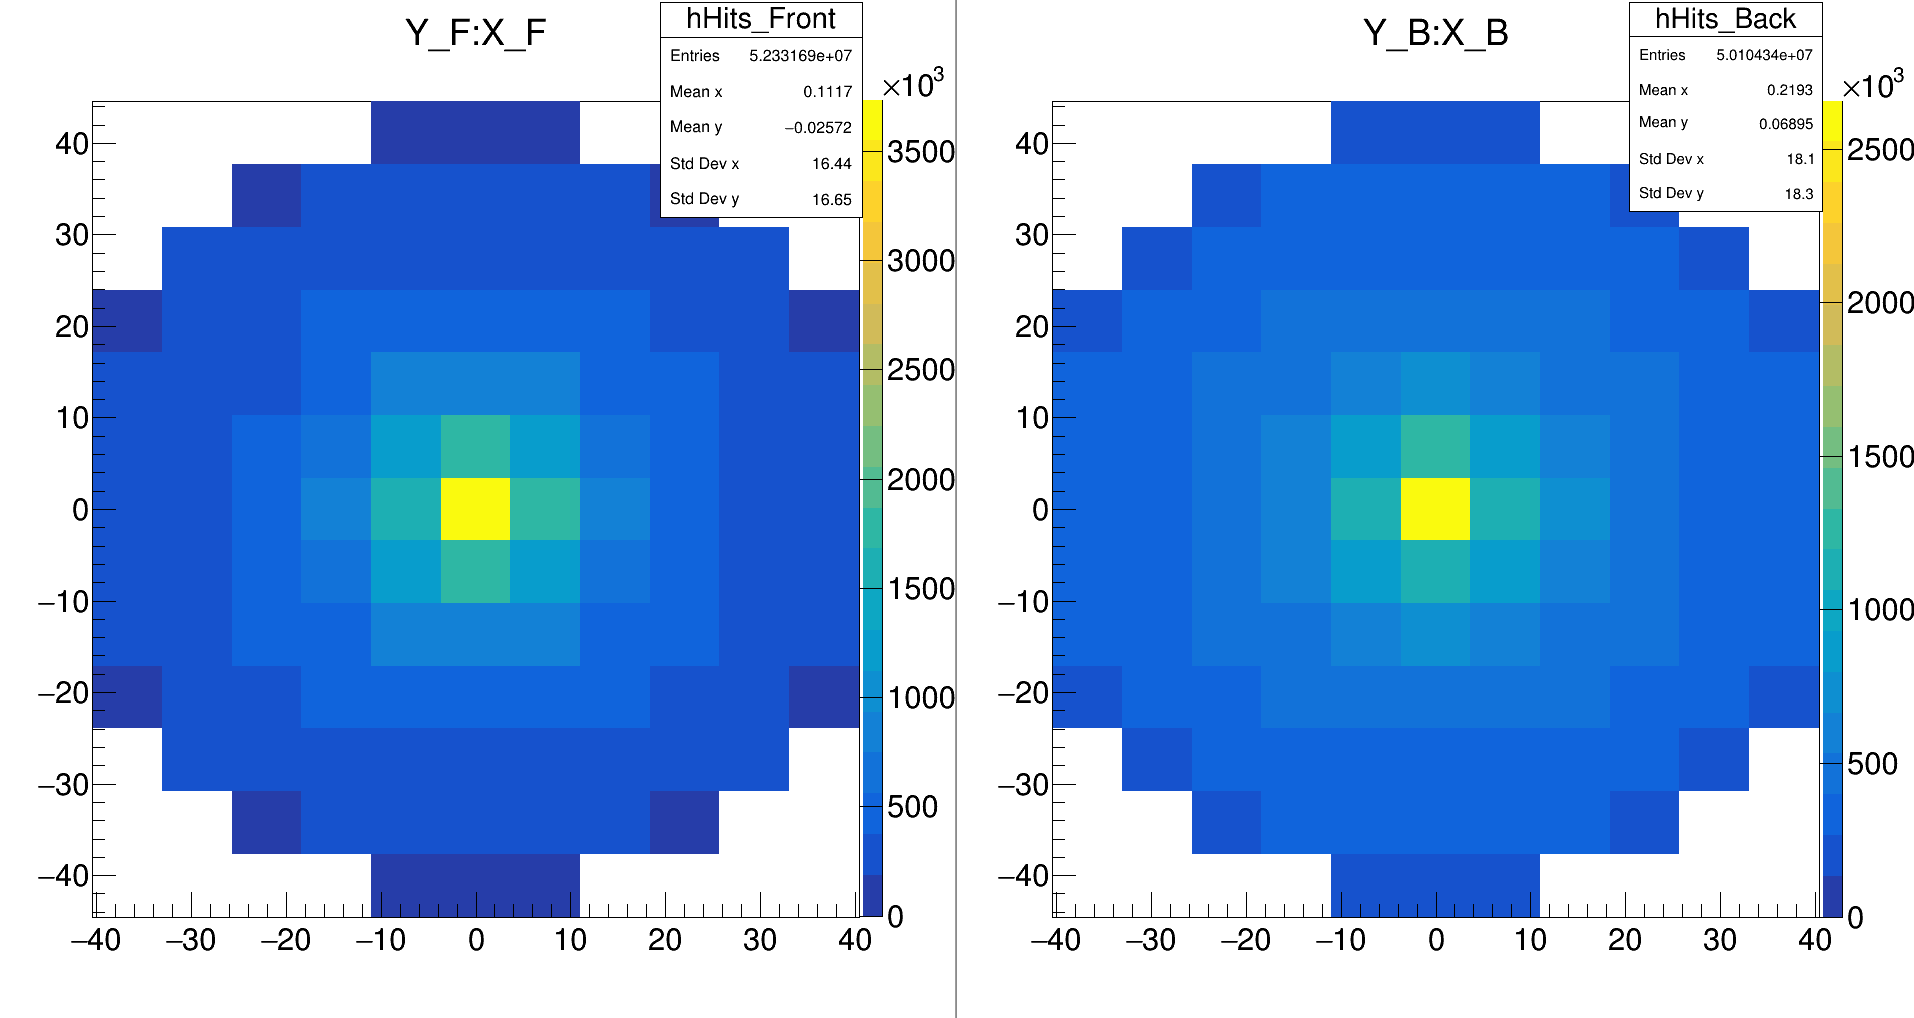
Certainly, the most interesting graph is the hit distribution on the Front and Back detectors. To obtain a representation where each pixel corresponds to a SiPM, the following ROOT command can be executed:
lyso->Draw("Y_F:X_F>>hHits_Front(11, -40.425, 40.425, 13, -44.525, 44.525)","","colz")
Similarly for the back face:
lyso->Draw("Y_B:X_B>>hHits_Back(11, -40.425, 40.425, 13, -44.525, 44.525)","","colz")
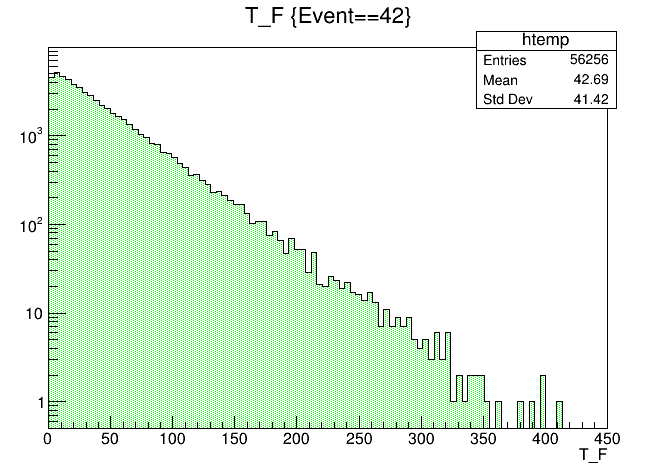
Another important piece of data, as it will be the input for the SiPM-response simulation, is the detection times. For example, by selecting a single event:
lyso->Draw("T_F","Event==42")
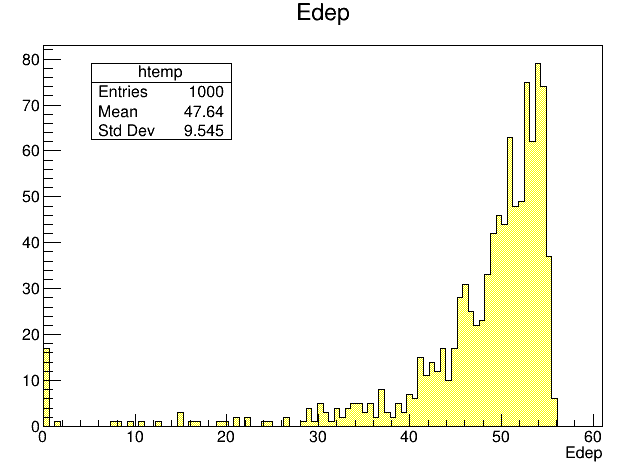
Regarding the release of energy in the active medium:
lyso->Draw("Edep")
This needs to be related to the number of hits, for example:
lyso->Draw("NHits_Tot")

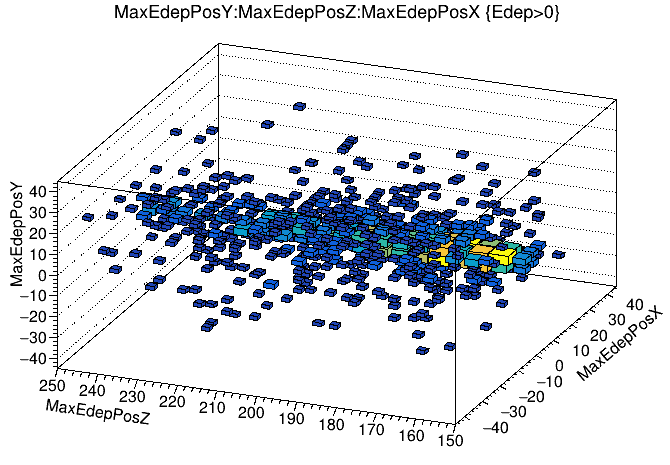
To conclude, an interesting graph is the distribution of the position of the maximum \( \frac{dE}{dx} \) in 3D:
lyso->Draw("MaxEdepPosY:MaxEdepPosZ:MaxEdepPosX","Edep>0","box2")
Calibration mode: output example
In the case of calibration mode, here is the output of a run with 1E6 optical photons generated from the Front-up LED:
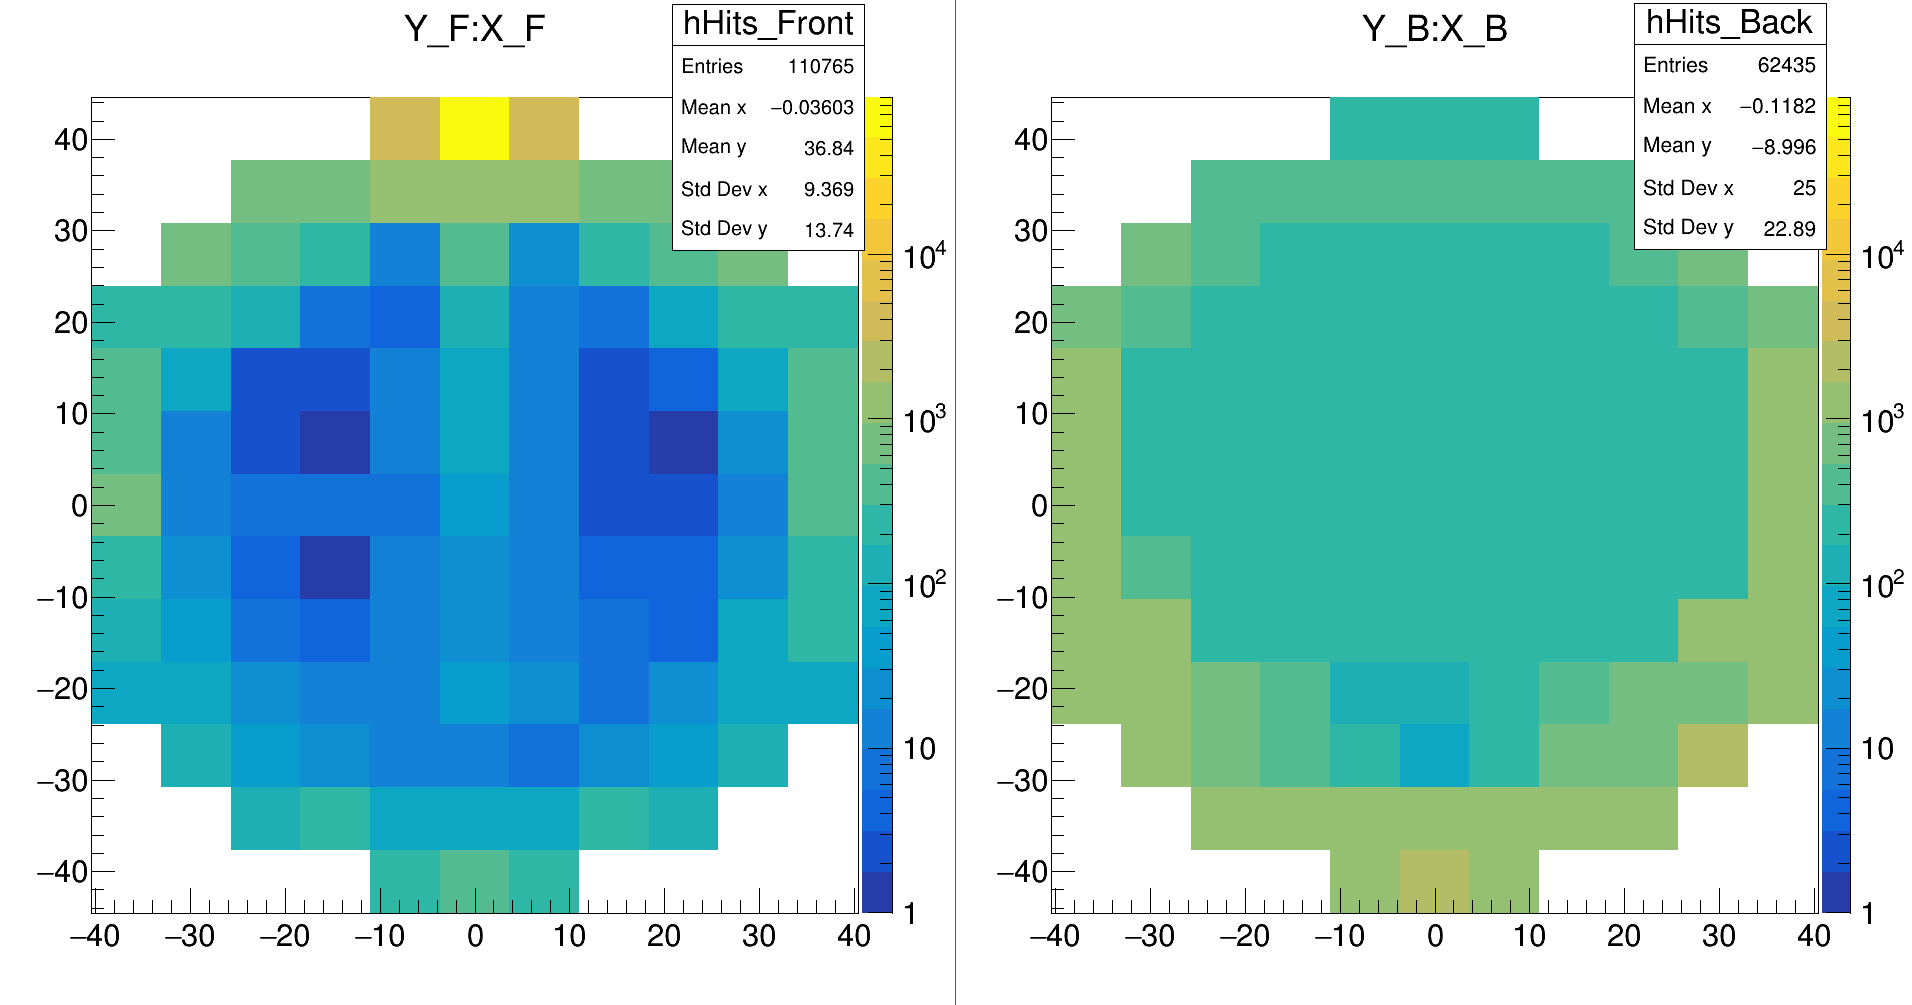
It can be observed that the illuminated LED could be used to calibrate the SiPMs diametrically opposite to it.
So, for example, by overlaying the hits obtained on the Back face from the activation of all 4 Front-LEDs:
